American League pitching leaders
American League batting leaders
National League pitching leaders
National League batting leaders
Published May 31, 2026
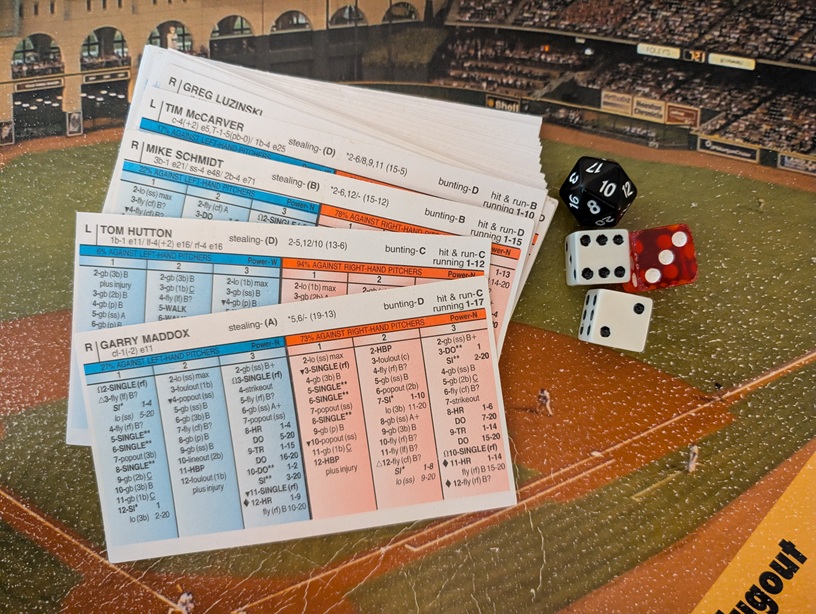
This Strat-o-Matic re-creation was born of watching baseball in the 2018 and 2019 seasons, when I had a half-season ticket plan for the Washington Nationals. I never saw any games in 1964 and 1965, but I know I like managing those games better than the 2019 games, and I think I would have enjoyed watching them more also. The idea of this Strat-o-Matic season, then, is to take 2019 players and teams and play them in a 1964 context to see how the results compare to either era.
The Washington Nationals used 31 different pitchers in both 2018 and 2019 – including three position players. In both seasons, 18 Nationals pitchers pitched at least 20 innings. Compare this to World Series Champions from a generation earlier: the 1980 Phillies used 17 pitchers (14 with 20+ innings), or the 1979 Pirates, who used 14 pitchers (12 with 20+ innings). A generation before that, the 1964 Cardinals used 18 pitchers (12 with 20+ IP); the 1965 Dodgers used 12 pitchers (10 with 20+ IP).
The table below shows the league leader totals in innings pitched and strikeouts, with the number of 200+ IP pitchers in each of those 6 seasons.
| Year | League | League Leader - IP | League Leader - SO | # of 200 IP Pitchers |
|---|---|---|---|---|
| 1964 | AL | Dean Chance (278) | Al Downing (217) | 20 |
| 1964 | NL | Don Drysdale (321) | Bob Veale (250) | 24 |
| 1965 | AL | Mel Stottlemyre (291) | Sam McDowell (325) | 17 |
| 1965 | NL | Sandy Koufax (335) | Sandy Koufax (382) | 25 |
| 1979 | AL | Dennis Martinez (292) | Nolan Ryan (223) | 26 |
| 1979 | NL | Phil Niekro (342) | J.R. Richard (313) | 28 |
| 1980 | AL | Rick Langford (290) | Len Barker (187) | 32 |
| 1980 | NL | Steve Carlton (304) | Steve Carlton (286) | 24 |
| 2018 | AL | Corey Kluber (215) | Justin Verlander (290) | 6 |
| 2018 | NL | Max Scherzer (220) | Max Scherzer (300) | 7 |
| 2019 | AL | Justin Verlander (223) | Gerrit Cole (326) | 8 |
| 2019 | NL | Stephen Strasburg (209) | Jacob deGrom (209) | 5 |
In the space of 30 years, the percentage of complete games pitched went from around 20% every season to less than 1%; the rate of strikeouts per nine innings went from a range of 5 to 6, to a range of 8 to 9.
The offensive statistics have some variation in speed vs. power and AL vs. NL, due to the DH rule and the unique ballpark characteristics of each era, but the overall trend of more home runs, leading to more runs per game, is clear. Home runs per game rise from 0.8 in 1964-65 to 1.7 in 2018-2019; runs per game (per team) increase from 4 to 6 in the same period.
To achieve a "1964 context" for this Strat-o-Matic mini-season, I used the following rules and guidelines:
I played both an AL and NL schedule involving 6 teams, but with a schedule that more closely resembles how schedules were constructed in 1964.
I set the schedule in late August and early September. The first portion of the season used the "summer" ballpark weather effects, and the last portion of the season used the spring/fall weather effects. The last game of every series was an afternoon game.
To simulate the injuries that occur in a full season, I roll the 20-sided die for each team prior to every game:
The biggest change from 2019 games will come from using pitchers closer to the way they were used in 1964. It's not exactly true to say that many or most teams used a 4-man rotation at this time. Managers were likely to use their top pitchers on 3-days rest to get as many starts from them as possible, but other pitchers were often given 4 or more days rest, to give one of the top starters an extra day or to align the rotation for more favorable matchups against the next opponent. It was also more frequent for pitchers who were mostly relievers to make a "spot" start, and for starters to pitch out of the bullpen in between starts.
To get closer to this usage pattern, I made the following adjustments:
I adjusted the hitting and bunting rating for some American League pitchers who did not bat enough in 2019 to have meaningful ratings on their card. I did this mostly for pitchers with previous National League experience who had some success as batters in the NL. For example, Mike Minor and Gerritt Cole were both assigned a #6 batting rating, and an "A" bunting rating.
Some teams were assigned different stadiums because their team didn't exist in 1964. The unusual stadium assignments are:
Some teams did not have enough position players in their Strat-o-Matic cards to construct a roster using my "1964 guidelines." I made the following adjustments:
| Rank | Team | W | L | Pct | Games Behind |
|---|---|---|---|---|---|
| 1 | Cleveland | 22 | 14 | 0.611 | - |
| 2 | Houston | 21 | 15 | 0.583 | 1 |
| 3 | Minnesota | 17 | 18 | 0.486 | 4.5 |
| 4 | Chicago | 16 | 19 | 0.457 | 5.5 |
| 5 | Texas | 16 | 19 | 0.457 | 5.5 |
| 6 | Oakland | 14 | 21 | 0.400 | 7.5 |
Most Valuable Hitter: Mark Canha, Oakland
Most Valuable Pitcher: Shane Bieber, Cleveland
| Rank | Team | W | L | Pct | Games Behind |
|---|---|---|---|---|---|
| 1 | Washington | 22 | 13 | 0.629 | - |
| 2 | Milwaukee | 21 | 14 | 0.600 | 1 |
| 3 | St Louis | 20 | 15 | 0.571 | 2 |
| 4 | Chicago | 16 | 19 | 0.457 | 6 |
| 5 | Atlanta | 16 | 19 | 0.457 | 6 |
| 6 | New York | 10 | 25 | 0.286 | 12 |
Most Valuable Hitter: Anthony Rizzo, Chicago
Most Valuable Pitcher: Jack Flaherty, St. Louis
Minimum 35 Innings Pitched
| Player | Team | IP | W | L | SO | BB | ERA | WHIP | SO9 |
|---|---|---|---|---|---|---|---|---|---|
| Mike Clevinger | CLE | 54.67 | 5 | 1 | 78 | 17 | 2.63 | 1.15 | 12.84 |
| Shane Bieber | CLE | 54.00 | 5 | 2 | 64 | 13 | 2.67 | 1.00 | 10.67 |
| Jose Berrios | MIN | 66.67 | 5 | 5 | 53 | 19 | 2.70 | 1.12 | 7.15 |
| Kyle Gibson | MIN | 41.33 | 3 | 3 | 35 | 14 | 3.05 | 1.26 | 7.62 |
| Trevor Bauer | CLE | 49.33 | 4 | 1 | 59 | 16 | 3.10 | 1.30 | 10.76 |
| Dylan Cease | CHA | 46.00 | 2 | 2 | 44 | 18 | 3.13 | 1.20 | 8.61 |
| Wade Miley | HOU | 37.00 | 4 | 2 | 30 | 14 | 3.16 | 1.32 | 7.30 |
| Gerrit Cole | HOU | 61.33 | 3 | 3 | 92 | 20 | 3.23 | 1.17 | 13.50 |
| Lucas Giolito | CHA | 63.67 | 3 | 4 | 71 | 23 | 3.25 | 1.16 | 10.04 |
| Justin Verlander | HOU | 55.00 | 5 | 1 | 68 | 12 | 3.60 | 0.87 | 11.13 |
| Mike Minor | TEX | 71.00 | 6 | 2 | 76 | 20 | 3.68 | 1.07 | 9.63 |
| Homer Bailey | OAK | 45.00 | 2 | 4 | 31 | 15 | 4.20 | 1.27 | 6.20 |
| Frankie Montas | OAK | 43.00 | 2 | 2 | 49 | 15 | 4.40 | 1.44 | 10.26 |
| Reynaldo Lopez | CHA | 35.00 | 2 | 3 | 29 | 11 | 4.63 | 1.51 | 7.46 |
| Brett Anderson | OAK | 44.33 | 3 | 2 | 18 | 14 | 4.67 | 1.51 | 3.65 |
| Chris Bassitt | OAK | 40.67 | 2 | 4 | 45 | 17 | 4.87 | 1.18 | 9.96 |
| Zack Greinke | HOU | 36.33 | 4 | 1 | 35 | 5 | 4.95 | 1.27 | 8.67 |
| Jake Odorizzi | MIN | 40.00 | 3 | 1 | 54 | 12 | 5.17 | 1.35 | 12.15 |
| Lance Lynn | TEX | 58.33 | 3 | 5 | 62 | 13 | 5.25 | 1.35 | 9.57 |
| Zach Plesac | CLE | 40.00 | 2 | 3 | 41 | 16 | 5.40 | 1.43 | 9.22 |
| Martin Perez | MIN | 36.00 | 1 | 2 | 28 | 11 | 6.00 | 1.58 | 7.00 |
| Ivan Nova | CHA | 45.00 | 0 | 4 | 22 | 9 | 6.20 | 1.60 | 4.40 |
| Mike Fiers | OAK | 42.00 | 1 | 6 | 33 | 9 | 6.64 | 1.62 | 7.07 |
| Mike Minor, TEX | 6 |
| Jose Berrios, MIN | 5 |
| Shane Bieber, CLE | 5 |
| Mike Clevinger, CLE | 5 |
| Justin Verlander, HOU | 5 |
| Trevor Bauer, CLE | 4 |
| Zack Greinke, HOU | 4 |
| Wade Miley, HOU | 4 |
| Mike Minor, TEX | 4 |
| Jose Berrios, MIN | 3 |
| Shane Bieber, CLE | 2 |
| Gerrit Cole, HOU | 2 |
| Lucas Giolito, CHA | 2 |
| Gerrit Cole, HOU | 92 |
| Mike Clevinger, CLE | 78 |
| Mike Minor, TEX | 76 |
| Lucas Giolito, CHA | 71 |
| Justin Verlander, HOU | 68 |
| Shane Bieber, CLE | 64 |
| Roberto Osuna, HOU | 11 |
| Brad Hand, CLE | 8 |
| Liam Hendriks, OAK | 7 |
| Alex Colome, CHA | 5 |
| Jose Leclerc, TEX | 4 |
| Taylor Rogers, MIN | 4 |
| Evan Marshall, CHA | 17 |
| Tyler Clippard, CLE | 16 |
| Joakim Soria, OAK | 15 |
| Aaron Bummer, CHA | 14 |
| Roberto Osuna, HOU | 14 |
| Jesse Chavez, TEX | 13 |
| Brad Hand, CLE | 13 |
| Brett Martin, TEX | 13 |
| Yusmeiro Petit, OAK | 13 |
| Sergio Romo, MIN | 13 |
| Blake Treinen, OAK | 13 |
Minimum 100 Plate Appearances
| Player | Team | AB | R | H | 2B | 3B | HR | RBI | BA | OBP | SLG |
|---|---|---|---|---|---|---|---|---|---|---|---|
| Yoan Moncada | CHA | 101 | 14 | 41 | 8 | 1 | 2 | 19 | 0.406 | 0.450 | 0.564 |
| Tim Anderson | CHA | 126 | 21 | 49 | 4 | 0 | 2 | 10 | 0.389 | 0.430 | 0.468 |
| Carlos Sanchez | CHA | 112 | 13 | 37 | 8 | 1 | 0 | 12 | 0.330 | 0.390 | 0.420 |
| Jorge Polanco | MIN | 123 | 19 | 40 | 8 | 1 | 1 | 14 | 0.325 | 0.403 | 0.431 |
| Luis Arraez | MIN | 114 | 15 | 37 | 8 | 0 | 1 | 8 | 0.325 | 0.398 | 0.421 |
| Mark Canha | OAK | 107 | 23 | 32 | 2 | 3 | 14 | 28 | 0.299 | 0.419 | 0.766 |
| Jose Abreu | CHA | 142 | 21 | 42 | 12 | 0 | 8 | 30 | 0.296 | 0.351 | 0.549 |
| Yuli Gurriel | HOU | 119 | 16 | 35 | 6 | 0 | 7 | 14 | 0.294 | 0.333 | 0.521 |
| Jurickson Profar | OAK | 103 | 17 | 30 | 7 | 1 | 9 | 14 | 0.291 | 0.381 | 0.641 |
| Francisco Lindor | CLE | 131 | 19 | 38 | 10 | 1 | 7 | 23 | 0.290 | 0.326 | 0.542 |
| Danny Santana | TEX | 139 | 26 | 40 | 6 | 0 | 11 | 32 | 0.288 | 0.317 | 0.568 |
| George Springer | HOU | 113 | 16 | 31 | 4 | 1 | 7 | 17 | 0.274 | 0.397 | 0.513 |
| Leury Garcia | CHA | 106 | 16 | 29 | 2 | 1 | 2 | 9 | 0.274 | 0.294 | 0.368 |
| Carlos Santana | CLE | 107 | 12 | 29 | 4 | 1 | 5 | 12 | 0.271 | 0.376 | 0.467 |
| Delino DeShields | TEX | 115 | 15 | 31 | 6 | 3 | 1 | 12 | 0.270 | 0.323 | 0.400 |
| Michael Brantley | HOU | 136 | 13 | 36 | 9 | 0 | 3 | 12 | 0.265 | 0.315 | 0.397 |
| James McCann | CHA | 104 | 15 | 26 | 6 | 1 | 9 | 21 | 0.250 | 0.304 | 0.587 |
| Marcus Semien | OAK | 132 | 18 | 33 | 7 | 1 | 3 | 12 | 0.250 | 0.322 | 0.386 |
| Jose Altuve | HOU | 140 | 18 | 35 | 4 | 0 | 7 | 20 | 0.250 | 0.335 | 0.429 |
| Alex Bregman | HOU | 124 | 27 | 30 | 6 | 1 | 4 | 18 | 0.242 | 0.409 | 0.403 |
| Jake Bauers | CLE | 101 | 15 | 24 | 5 | 1 | 6 | 12 | 0.238 | 0.294 | 0.485 |
| Jason Kipnis | CLE | 101 | 11 | 23 | 4 | 0 | 3 | 13 | 0.228 | 0.271 | 0.356 |
| Jose Ramirez | CLE | 120 | 17 | 23 | 4 | 0 | 8 | 17 | 0.192 | 0.248 | 0.425 |
| Matt Olson | OAK | 120 | 11 | 23 | 5 | 0 | 6 | 14 | 0.192 | 0.271 | 0.383 |
| Ramon Laureano | OAK | 121 | 9 | 23 | 7 | 0 | 4 | 12 | 0.190 | 0.234 | 0.347 |
| Elvis Andrus | TEX | 121 | 15 | 23 | 4 | 0 | 3 | 12 | 0.190 | 0.228 | 0.298 |
| Eddie Rosario | MIN | 107 | 11 | 20 | 5 | 0 | 2 | 10 | 0.187 | 0.202 | 0.290 |
| Adam Engel | CHA | 104 | 12 | 19 | 0 | 2 | 2 | 8 | 0.183 | 0.220 | 0.279 |
| Max Kepler | MIN | 105 | 19 | 18 | 6 | 0 | 8 | 17 | 0.171 | 0.269 | 0.457 |
| Mark Canha, OAK | 14 |
| Mitch Garver, MIN | 11 |
| Miguel Sano, MIN | 11 |
| Danny Santana, TEX | 11 |
| Nelson Cruz, MIN | 9 |
| James McCann, CHA | 9 |
| Jurickson Profar, OAK | 9 |
| Jose Abreu, CHA | 12 |
| Byron Buxton, MIN | 12 |
| Francisco Lindor, CLE | 10 |
| Michael Brantley, HOU | 9 |
| Tyler Naquin, CLE | 9 |
| Luis Arraez, MIN | 8 |
| Matt Chapman, OAK | 8 |
| Yoan Moncada, CHA | 8 |
| Jorge Polanco, MIN | 8 |
| Carlos Sanchez, CHA | 8 |
| Byron Buxton, MIN | 4 |
| Mark Canha, OAK | 3 |
| Delino DeShields, TEX | 3 |
| Adam Engel, CHA | 2 |
| Eloy Jimenez, CHA | 2 |
| Alex Bregman, HOU | 27 |
| Danny Santana, TEX | 26 |
| Mark Canha, OAK | 23 |
| Jose Abreu, CHA | 21 |
| Tim Anderson, CHA | 21 |
| Joey Gallo, TEX | 19 |
| Max Kepler, MIN | 19 |
| Francisco Lindor, CLE | 19 |
| Jorge Polanco, MIN | 19 |
| Danny Santana, TEX | 32 |
| Jose Abreu, CHA | 30 |
| Mark Canha, OAK | 28 |
| Francisco Lindor, CLE | 23 |
| Miguel Sano, MIN | 23 |
| Nomar Mazara, TEX | 22 |
| Danny Santana, TEX | 7 |
| Tim Anderson, CHA | 5 |
| Jose Altuve, HOU | 3 |
| Elvis Andrus, TEX | 3 |
| Francisco Lindor, CLE | 3 |
| Marcus Semien, OAK | 3 |
Minimum 35 Innings Pitched
| Player | Team | IP | W | L | SO | BB | ERA | WHIP | SO9 |
|---|---|---|---|---|---|---|---|---|---|
| Max Scherzer | WAS | 52.00 | 4 | 2 | 68 | 10 | 1.90 | 0.85 | 11.77 |
| Jack Flaherty | SLN | 53.00 | 5 | 0 | 78 | 17 | 2.21 | 0.98 | 13.25 |
| Dakota Hudson | SLN | 46.33 | 3 | 3 | 45 | 29 | 2.72 | 1.34 | 8.74 |
| Brandon Woodruff | MIL | 50.67 | 4 | 2 | 65 | 18 | 2.84 | 1.28 | 11.55 |
| Patrick Corbin | WAS | 55.67 | 7 | 1 | 69 | 24 | 2.91 | 1.35 | 11.16 |
| Mike Soroka | ATL | 48.33 | 2 | 4 | 38 | 8 | 3.17 | 0.99 | 7.08 |
| Gio Gonzalez | MIL | 44.33 | 4 | 2 | 38 | 17 | 3.25 | 1.33 | 7.71 |
| Zach Davies | MIL | 45.33 | 2 | 3 | 28 | 11 | 3.57 | 1.35 | 5.56 |
| Jacob deGrom | NYN | 61.33 | 4 | 3 | 72 | 23 | 3.67 | 1.19 | 10.57 |
| Jordan Lyles | MIL | 44.00 | 3 | 1 | 40 | 21 | 3.68 | 1.30 | 8.18 |
| Stephen Strasburg | WAS | 63.00 | 6 | 1 | 75 | 17 | 3.86 | 1.30 | 10.71 |
| Yu Darvish | CHN | 46.67 | 1 | 5 | 63 | 19 | 4.44 | 1.24 | 12.15 |
| Miles Mikolas | SLN | 50.33 | 4 | 3 | 34 | 16 | 4.47 | 1.51 | 6.08 |
| Jon Lester | CHN | 41.00 | 3 | 1 | 39 | 14 | 4.61 | 1.63 | 8.56 |
| Mike Foltynewicz | ATL | 44.33 | 1 | 2 | 37 | 14 | 4.67 | 1.29 | 7.51 |
| Noah Syndergaard | NYN | 52.67 | 3 | 4 | 53 | 17 | 4.78 | 1.50 | 9.06 |
| Zack Wheeler | NYN | 54.33 | 3 | 2 | 52 | 19 | 4.80 | 1.42 | 8.61 |
| Max Fried | ATL | 51.33 | 2 | 4 | 55 | 18 | 4.91 | 1.44 | 9.64 |
| Julio Teheran | ATL | 36.33 | 2 | 2 | 32 | 15 | 4.95 | 1.51 | 7.93 |
| Cole Hamels | CHN | 40.33 | 3 | 1 | 56 | 14 | 5.80 | 1.54 | 12.50 |
| Adam Wainwright | SLN | 40.67 | 2 | 3 | 43 | 10 | 6.20 | 1.57 | 9.52 |
| Kyle Hendricks | CHN | 41.00 | 2 | 4 | 31 | 11 | 6.37 | 1.59 | 6.80 |
| Patrick Corbin, WAS | 7 |
| Stephen Strasburg, WAS | 6 |
| Jack Flaherty, SLN | 5 |
| Gio Gonzalez, MIL | 4 |
| Miles Mikolas, SLN | 4 |
| Max Scherzer, WAS | 4 |
| Brandon Woodruff, MIL | 4 |
| Jacob deGrom, NYN | 4 |
| Patrick Corbin, WAS | 2 |
| Jack Flaherty, SLN | 2 |
| Mike Soroka, ATL | 2 |
| Zack Wheeler, NYN | 2 |
| Jacob deGrom, NYN | 2 |
| Jack Flaherty, SLN | 78 |
| Stephen Strasburg, WAS | 75 |
| Jacob deGrom, NYN | 72 |
| Patrick Corbin, WAS | 69 |
| Max Scherzer, WAS | 68 |
| Brandon Woodruff, MIL | 65 |
| Josh Hader, MIL | 8 |
| Daniel Hudson, WAS | 6 |
| Mark Melancon, ATL | 6 |
| Sean Doolittle, WAS | 4 |
| Andrew Miller, SLN | 3 |
| Seth Lugo, NYN | 2 |
| Steve Cishek, CHN | 20 |
| Kyle Ryan, CHN | 19 |
| Sean Doolittle, WAS | 18 |
| Justin Wilson, NYN | 17 |
| Alex Claudio, MIL | 16 |
| Luke Jackson, ATL | 15 |
Minimum 100 Plate Appearances
| Player | Team | AB | R | H | 2B | 3B | HR | RBI | BA | OBP | SLG |
|---|---|---|---|---|---|---|---|---|---|---|---|
| Tommy Edman | SLN | 115 | 18 | 49 | 10 | 4 | 3 | 18 | 0.426 | 0.459 | 0.661 |
| Anthony Rizzo | CHN | 105 | 24 | 41 | 9 | 1 | 7 | 23 | 0.390 | 0.492 | 0.695 |
| Nick Castellanos | CHN | 101 | 17 | 37 | 12 | 0 | 6 | 16 | 0.366 | 0.366 | 0.663 |
| Paul Goldschmidt | SLN | 130 | 24 | 43 | 4 | 1 | 10 | 21 | 0.331 | 0.404 | 0.608 |
| Yadier Molina | SLN | 103 | 16 | 34 | 14 | 1 | 1 | 12 | 0.330 | 0.373 | 0.515 |
| Adam Eaton | WAS | 104 | 21 | 34 | 4 | 2 | 3 | 14 | 0.327 | 0.407 | 0.490 |
| Keston Hiura | MIL | 122 | 25 | 39 | 8 | 0 | 9 | 25 | 0.320 | 0.390 | 0.607 |
| Trea Turner | WAS | 140 | 29 | 44 | 12 | 0 | 3 | 11 | 0.314 | 0.392 | 0.464 |
| Ozzie Albies | ATL | 130 | 16 | 40 | 6 | 1 | 5 | 13 | 0.308 | 0.362 | 0.485 |
| Paul DeJong | SLN | 122 | 18 | 37 | 11 | 0 | 7 | 20 | 0.303 | 0.370 | 0.566 |
| Javier Baez | CHN | 121 | 15 | 35 | 7 | 0 | 9 | 23 | 0.289 | 0.312 | 0.570 |
| Anthony Rendon | WAS | 119 | 23 | 34 | 6 | 1 | 5 | 22 | 0.286 | 0.393 | 0.479 |
| Victor Robles | WAS | 118 | 15 | 33 | 7 | 0 | 4 | 9 | 0.280 | 0.325 | 0.441 |
| Willson Contreras | CHN | 101 | 22 | 28 | 2 | 1 | 8 | 23 | 0.277 | 0.411 | 0.554 |
| Nick Markakis | ATL | 123 | 11 | 34 | 3 | 0 | 1 | 15 | 0.276 | 0.331 | 0.325 |
| Christian Yelich | MIL | 116 | 24 | 32 | 3 | 0 | 7 | 17 | 0.276 | 0.396 | 0.483 |
| Kris Bryant | CHN | 115 | 20 | 29 | 5 | 0 | 9 | 14 | 0.252 | 0.358 | 0.530 |
| Juan Soto | WAS | 118 | 24 | 29 | 10 | 0 | 5 | 19 | 0.246 | 0.407 | 0.458 |
| Amed Rosario | NYN | 114 | 10 | 28 | 6 | 0 | 4 | 14 | 0.246 | 0.283 | 0.404 |
| Kolten Wong | SLN | 111 | 18 | 27 | 3 | 2 | 4 | 15 | 0.243 | 0.294 | 0.414 |
| Ian Happ | CHN | 103 | 19 | 24 | 0 | 3 | 9 | 17 | 0.233 | 0.275 | 0.553 |
| Dansby Swanson | ATL | 109 | 15 | 25 | 5 | 0 | 6 | 9 | 0.229 | 0.323 | 0.440 |
| Michael Conforto | NYN | 119 | 16 | 27 | 6 | 0 | 5 | 12 | 0.227 | 0.333 | 0.403 |
| Orlando Arcia | MIL | 111 | 9 | 25 | 2 | 1 | 3 | 10 | 0.225 | 0.277 | 0.342 |
| Freddie Freeman | ATL | 120 | 15 | 27 | 3 | 0 | 7 | 14 | 0.225 | 0.321 | 0.425 |
| Marcell Ozuna | SLN | 100 | 11 | 22 | 5 | 0 | 3 | 12 | 0.220 | 0.304 | 0.360 |
| Pete Alonso | NYN | 110 | 12 | 24 | 5 | 0 | 9 | 19 | 0.218 | 0.323 | 0.509 |
| Josh Donaldson | ATL | 111 | 11 | 24 | 6 | 1 | 5 | 16 | 0.216 | 0.326 | 0.423 |
| Mike Moustakas | MIL | 100 | 13 | 21 | 4 | 1 | 7 | 18 | 0.210 | 0.275 | 0.480 |
| Ronald Acuna | ATL | 132 | 18 | 26 | 5 | 0 | 5 | 10 | 0.197 | 0.274 | 0.348 |
| Harrison Bader | SLN | 108 | 18 | 17 | 1 | 2 | 5 | 16 | 0.157 | 0.295 | 0.343 |
| Kyle Schwarber, CHN | 11 |
| Paul Goldschmidt, SLN | 10 |
| Pete Alonso, NYN | 9 |
| Javier Baez, CHN | 9 |
| Ryan Braun, MIL | 9 |
| Kris Bryant, CHN | 9 |
| Ian Happ, CHN | 9 |
| Keston Hiura, MIL | 9 |
| Yadier Molina, SLN | 14 |
| Nick Castellanos, CHN | 12 |
| Trea Turner, WAS | 12 |
| Paul DeJong, SLN | 11 |
| Tommy Edman, SLN | 10 |
| Juan Soto, WAS | 10 |
| Tommy Edman, SLN | 4 |
| Ian Happ, CHN | 3 |
| Harrison Bader, SLN | 2 |
| Adam Eaton, WAS | 2 |
| Tyler Flowers, ATL | 2 |
| Addison Russell, CHN | 2 |
| Eric Thames, MIL | 2 |
| Matt Wieters, SLN | 2 |
| Kolten Wong, SLN | 2 |
| Trea Turner, WAS | 29 |
| Keston Hiura, MIL | 25 |
| Paul Goldschmidt, SLN | 24 |
| Anthony Rizzo, CHN | 24 |
| Juan Soto, WAS | 24 |
| Christian Yelich, MIL | 24 |
| Keston Hiura, MIL | 25 |
| Ryan Braun, MIL | 24 |
| Ryan Zimmerman, WAS | 24 |
| Javier Baez, CHN | 23 |
| Willson Contreras, CHN | 23 |
| Anthony Rizzo, CHN | 23 |
| Kyle Schwarber, CHN | 23 |
| Trea Turner, WAS | 7 |
| Ronald Acuna, ATL | 4 |
| Kolten Wong, SLN | 4 |
| Harrison Bader, SLN | 3 |
| Adam Eaton, WAS | 3 |
| Lorenzo Cain, MIL | 2 |
| Matt Carpenter, SLN | 2 |
| Paul Goldschmidt, SLN | 2 |
| Ender Inciarte, ATL | 2 |
| Game 1 – Connie Mack Stadium | R | H | E | Pitchers | |||||||||||
|---|---|---|---|---|---|---|---|---|---|---|---|---|---|---|---|
| CLE | 2 | 0 | 0 | 0 | 0 | 0 | 0 | 0 | 0 | 2 | 7 | 0 | Bauer (6), Wittgren (1) L, Perez (.2), Clippard (.1) | ||
| WAS | 0 | 0 | 0 | 0 | 1 | 1 | 1 | 1 | X | 4 | 8 | 0 | Scherzer (9) W | ||
Scherzer went the distance for the Nationals, allowing only two first inning runs, to give the Nationals the lead in the Series. Bauer held the Nats scoreless through 4 innings, but allowed runs on a solo home run by Robles in the fifth and a triple by Soto in the 6th. Eaton and Soto added solo home runs off the bullpen.
| Game 2 – Connie Mack Stadium | R | H | E | Pitchers | |||||||||||
|---|---|---|---|---|---|---|---|---|---|---|---|---|---|---|---|
| CLE | 0 | 1 | 0 | 0 | 3 | 1 | 0 | 0 | 0 | 5 | 9 | 0 | Plesac (5), Civale (0), Wood (1) L, Clippard (1), Hand (1) | ||
| WAS | 0 | 0 | 0 | 0 | 1 | 5 | 0 | 0 | X | 6 | 6 | 0 | Corbin (6) W, Suero (1), Doolittle (1), Hudson (1) | ||
Ramirez put the Indians on top with a 3-run home run in the 5th inning, but the Tribe's decision to lift Plesac for a pinch-hitter in the 6th inning proved disastrous when reliever Civale allowed the first four batters in the bottom of the inning to reach on 3 walks and a single. Wood relieved and got the first out, but then coughed up a grand slam to Rendon to give the Nationals the lead.
| Game 3 – Municipal Stadium | R | H | E | Pitchers | |||||||||||
|---|---|---|---|---|---|---|---|---|---|---|---|---|---|---|---|
| WAS | 0 | 0 | 0 | 0 | 0 | 1 | 2 | 0 | 0 | 3 | 7 | 4 | Strasburg (6) L, Rodney (1), Doolittle (1) | ||
| CLE | 0 | 0 | 1 | 0 | 2 | 1 | 0 | 0 | X | 4 | 6 | 2 | Bieber (6.2) W, Perez (.1), Clippard (1), Hand (1) Sv | ||
The Indians got their first win in the Series behind the pitching of Bieber and home runs from Lindor and Santana. After Bieber tired in the 7th, Perez, Clippard, and Hand shut down the Nationals to preserve the victory.
| Game 4 – Municipal Stadium | R | H | E | Pitchers | |||||||||||
|---|---|---|---|---|---|---|---|---|---|---|---|---|---|---|---|
| WAS | 0 | 1 | 1 | 0 | 0 | 0 | 0 | 0 | 0 | 2 | 4 | 0 | Sanchez (8.1) W, Hudson (.2) Sv | ||
| CLE | 0 | 0 | 0 | 0 | 0 | 0 | 0 | 0 | 0 | 0 | 3 | 0 | Clevinger (9) L | ||
Sanchez outdueled Clevinger to put the Nationals up 3-1 in the Series. The Nats scored on RBI singles by Zimmerman in the second and Soto in the third. Sanchez allowed just one hit through 8 innings, then put two aboard in the ninth; Hudson relieved and retired Naquin and Ramirez to preserve the shutout.
| Game 5 – Municipal Stadium | R | H | E | Pitchers | |||||||||||
|---|---|---|---|---|---|---|---|---|---|---|---|---|---|---|---|
| WAS | 1 | 0 | 1 | 0 | 0 | 0 | 1 | 0 | 0 | 3 | 9 | 0 | Scherzer (6) L, Rodney (1), Rainey (1) | ||
| CLE | 3 | 0 | 0 | 0 | 1 | 0 | 0 | 0 | X | 4 | 5 | 1 | Bauer (7) W, Clippard (1), Hand (1) | ||
Naquin homered twice to back the pitching of Bauer and keep the Indians in the Series.
| Game 6 – Connie Mack Stadium | R | H | E | Pitchers | |||||||||||
|---|---|---|---|---|---|---|---|---|---|---|---|---|---|---|---|
| CLE | 0 | 2 | 0 | 0 | 0 | 1 | 1 | 0 | 0 | 4 | 11 | 0 | Plesac (5), Perez (.2), Wittgren (1.1), Carrasco (.1) L, Clippard (.2) | ||
| WAS | 0 | 2 | 0 | 1 | 0 | 1 | 0 | 2 | X | 6 | 8 | 1 | Corbin (6.2), Suero (.1), Doolittle (1) W, Hudson (1) Sv | ||
The Nationals won their first championship in franchise history in this back-and-forth battle. After Mercado tied the game with a solo home run in the 7th, the Nats loaded the bases in the bottom of the 8th with a single by Soto, a double by Rendon, and an intentional walk to Cabrera. The strategy backfired when Clippard walked the first two batters he faced to force in the winning runs. The Indians early lead on hits by Naquin, Luplow, and Plesac was erased on a two-run home run by Robles. Rendon went 3-4 with two doubles and two runs scored to claim Series MVP honors.
In the National League, the final standings were highly aligned with the actual 2019 season – the Braves underperformed their 97-win season, but the other teams had similar results. The 2019 Nationals famously were 19-31 on May 23, before going 74-38 the rest of the way. The Nationals made two relatively minor roster changes that had an outsized impact on their performance down the stretch. The Nats signed Asdrubel Cabrera on August 6 after he was released by the Rangers. Cabrera, playing nearly every day at either 2B, 3B, or 1B, hit .323 and knocked in 40 runs in just 38 games; while Brian Dozier and his .238 batting average for the year saw reduced playing time.
The other move was acquiring reliever Daniel Hudson from the Blue Jays for a minor leaguer. Hudson pitched mostly in the 7th and 8th innings in early August when he first joined the Nationals. But when Nats closer Sean Doolittle hit a rough patch, landing on the disabled list after allowing 4 runs and blowing a save in a 14-inning loss to the Brewers on August 17, Hudson moved into the closer role and recorded 6 saves and a win in September. Having Hudson as the closer allowed Doolittle to pitch in the earlier innings when he returned from the IL, often matching up against opponent's left-handed hitters.
I had Cabrera and Hudson on the Nationals roster for the entire season, and used them similarly to how Dave Martinez did for the Nats. Cabrera batted .381 with 15 RBI in 70 plate appearances, while Dozier batted .216 in 42 plate appearances. I used both Hudson and Doolittle in save situations, matching Doolittle against tough lefties like Freddy Freeman, Michael Conforto, and Christian Yellich.
In the American League, Cleveland and Houston finished the regular season in a tie with the Indians winning a one-game playoff to advance to the World Series. Houston and Minnesota, who each won over 100 games in 2019, slightly underperformed in the Retro season.
The differences are small; if I had to offer a reason for the slightly worse performances of the Astros and Twins, I would suggest that they were disadvantaged by the lack of the DH, while the Indians were relatively helped. Nelson Cruz had the majority of DH appearances for the Twins (with no games played in the field) and Yordan Alvarez was the primary DH for the Astros (only 10 games in the outfield). Managing these teams without a DH, I had to either leave those potent bats on the bench or pay the penalty of playing a poor defensive outfielder.
Cleveland, on the other hand, split DH at bats among Franmil Reyes, Jake Bauers, Carlos Santana, and a handful of others. Except for Reyes, none of these are poor defensive players. Reyes had only 194 plate appearances for the Indians after being acquired at the trading deadline, and I did not include him on the 25-man roster for the Retro season. Had the DH been used, I would have added an average hitter to the Indians lineup, not a star the caliber of Nelson Cruz or Yordan Alvarez.
So how did the totals in run scored, home runs, and strikeouts compare to the real 1964 and 2019 seasons?
| Season | League | Runs per Game | SO per Game | HR per Game |
|---|---|---|---|---|
| 1964 | AL | 4.05 | 6.12 | 0.95 |
| NL | 4.01 | 5.70 | 0.76 | |
| 2019 Retro | AL | 4.38 | 8.78 | 1.33 |
| NL | 4.91 | 8.77 | 1.51 | |
| 2019 | AL | 4.88 | 8.82 | 1.43 |
| NL | 4.78 | 8.81 | 1.35 |
The per game results from the 2019 Retro Strat-o-Matic season are, as expected, somewhere between the actual 2019 season and the 1964 season - though much closer to 2019. The lack of a DH in American League games brought the AL runs and home runs down a little, but the adjustments I made to put the game in a 1964 context were no match for the home run and strikeout totals on the 2019 player cards.
The fact that the NL home runs per game were higher in the 2019 Retro season is likely explained by my selection of teams: 5 of the 6 teams I played were in the top 6 in the NL in home runs in 2019 – only the Cardinals were below league average.
The 2019 Retro Season featured three star players who would soon fall upon hard times: Kris Bryant, Nick Castellanos, and Anthony Rendon.
Bryant, in his age 27 season, was just three years removed from his MVP year in 2016 and still a key contributor to the Cubs offense. Castellanos, also 27 in 2019, was hitting .273 with 11 home runs with Detroit when he was traded to the Cubs at the trade deadline. He proceeded to tear up the National League, batting .321 with 21 doubles and 16 home runs in just 51 games - a .646 slugging percentage. Anthony Rendon was on top of the world at the end of his age 29 season: a well-deserved third-place finish in the NL MVP voting, a World Series title, and an expiring contract that had him filing for free agency at the peak of his career.
Fast-forward to 2026: Bryant hasn't played a full season since 2021 and played in just 11 games in 2025; Castellanos signed with the Padres for the major league minumum salary after Philadephia released him prior to the 2026 season with a year remaining on his 4-year $80M contract; and not to be outdone, Rendon will miss the 2026 season after not being ready to play following hip surgery prior to the 2025 season. The Angels and Rendon agreed on a restructuring of the final year of his contract that will pay him the $38M he is owed over five years, instead of in one year – no one expects to see him in a major league uniform again.
How do these fallen stars compare to similar players who were at the top of their game in their late 20s? This is exactly the question I designed the Shark WAR Player Similarity algorithm to answer. The algorithm looks at a players statistics through a "target" season, and identifies the most similar players, based on a season-age by season-age comparison of their careers up to that point.
Here are the most similar players to these three fallen stars, comparing their performance over the next three years and the remainder of their career. Numbers in the tables are SharkWAR, except for the last column, which is Baseball-Reference WAR.
| Player (age) | Similarity Score | Up to Age 27 | Next 3 Years | Remaining Career | Remaining Career (bWAR) |
|---|---|---|---|---|---|
| Kris Bryant | 26.2 | 3.7 | 3.2 | 2.1 | |
| Evan Longoria | 78.5 | 31.2 | 9.5 | 20.7 | 23.4 |
Kris Bryant was hitting .267/.358/.503 when the Cubs traded him to the Giants at the trade deadline in 2021, ahead of his pending free-agency. Bryant helped the Giants win the NL West, then signed a 7-year, $182 million contract with the Colorado Rockies. At the time, the primary reaction to the contract was not about Bryant's value, but about why the Rockies were now willing to pay for a third-baseman when just a year earlier they let Nolan Arenado leave in free agency.
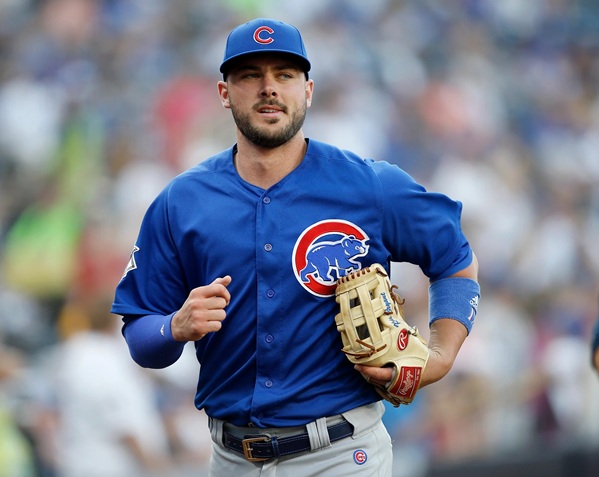
Bryant missed almost all of May and June, 2022 with a back injury, then after playing the month of July, missed the rest of the season with plantar fascitis and a bone bruise in his foot. At the end of the season he considered returning for a few weeks, but with the Rockies in last place and concern for the health of his foot, it was decided to call it a season. There was no mention of the back as an issue. He missed about half of the 2023 season with a left heel bruise and fractured index finger.
Early in the 2024 season, though, the injury report mentioned "low back strain." After playing just 37 games that season (and batting .218 with 2 home runs), the injury was described at the start of the 2025 season as a degenerative back condition, "chronic lumbar degenerative disk disease." It's an open question as to when or if he will be able to resume a major league baseball career.
The comparison with Evan Longoria is what I was expecting to see from the Similarity algorithm: they were fairly similar up to the "target" year of their careers (age 27), then Bryant fell on hard times while Longoria continued to be a solid player into his mid-30's, outperforming Bryant for their careers by a long shot.
The other two comparisons are not so clean.
| Player (age) | Similarity Score | Up to Age 27 | Next 3 Years | Remaining Career | Remaining Career (bWAR) |
|---|---|---|---|---|---|
| Nick Castellanos | 10.1 | 6.3 | 12.1 | 3.4 | |
| Jim Ray Hart | 63.6 | 27.0 | 0.7 | 2.2 | 1.0 |
Nick Castellanos broke in with the Tigers as a third baseman at age 22 (in 2014), hitting .259/.306/.394 with 31 doubles. He finished 8th in the AL Rookie of the Year voting. He was a sub-par defensive third baseman and converted to the outfield a few years later.
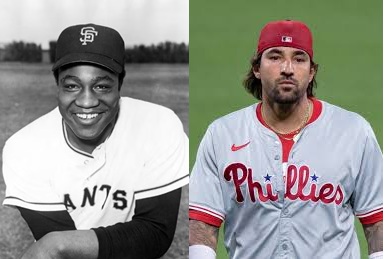
Jim Ray Hart broke in with the Gians as a third baseman at age 22 (in 1964), hitting .286/.342/.498, with 31 home runs. He finished 2nd in the NL Rookie of the Year voting, to Dick Allen. (Hart won the Player of the Year in the Eastern League in 1962, with Allen finishing second.) He was a sub-par defensive third baseman and converted to the outfield a few years later.
Hart had trouble with his weight – he gained about 30 pounds during the 1967 season – and he had trouble with alcohol. His father was a bootlegger in Greene County, North Carolina, and Hart admitted after his playing days that he had started drinking corn whiskey as a teenager.
The combination of excess weight, injuries, and alcohol use led to Hart becoming a part-time player by 1968. He was sent to the minor leagues for parts of the 1970, '71, and '72 seasons, then was sold to the Yankees early in the 1973 season. He had a moderately successful year as a DH for the Yankees, but by this time his drinking was a serious problem and he was released by the Yankees early in 1974. He finished his playing days with the Rieleros de Aguascalientes in the Mexican League.
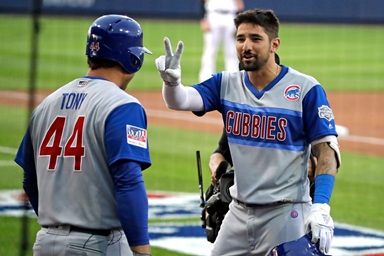
OK, so Nick Castellanos only had a can of beer in the dugout, not a Mason jar of moonshine, after being removed from a game for the Phillies... but can't you see Nicky C finishing out his playing career in the Mexican League in the not-too-distant future?
| Player (age) | Similarity Score | Up to Age 29 | Next 3 Years | Remaining Career | Remaining Career (bWAR) |
|---|---|---|---|---|---|
| Anthony Rendon | 25.5 | 3.2 | 3.3 | 3.9 | |
| Kyle Seager | 82.0 | 33.4 | 8.3 | 10.0 | 7.1 |
Anthony Rendon cashed in on free agency to the tune of $245 million over 7 years. He performed well for the Angels in the shortened 2020 season (.286/.418/.915), but suffered groin, knee, tricpes, and hip injuries in 2021 that limited him to 58 games. More injuries followed in the next two seasons – all told, he played just 257 games in the first 5 seasons of his deal, and none in the last two. Even when healthy, his productivity declined drastically. His batting average never rose above .240 after 2020, and his home run ratio steadily declined from 6% in his final year with the Nats, to 5% in 2020, dipping to 1% in 2023, finally to zero in 2024.
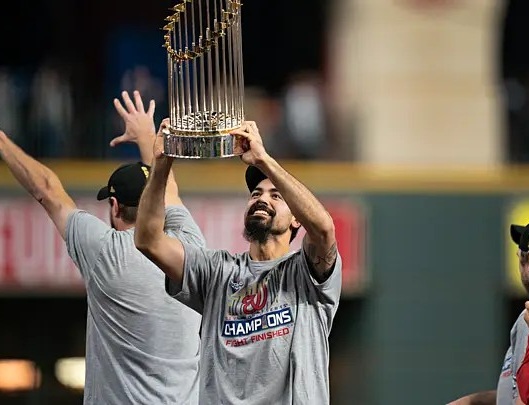
What got to Angels fans even worse, though, were comments Rendon made to reporters in the spring of 2024, when he said that baseball "has never been a top priority. This is a job," he said. "I do this to make a living. My faith and my family come first before this job."
Those are fine sentiments for the father of four children; but when have you ever heard a baseball player say something like that out loud?
Just two years older than Rendon, Seager had an outstanding season at age 26. He signed a 7-year, $100M deal with the Mariners after that season, three years before he was eligible for free agency. He finished 12th in the AL MVP voting in 2016, his age 28 season, batting .278 with 30 home runs and 99 RBI. He was an excellent third-baseman with solid defensive metrics througout his career, winning one Gold Glove.
This is where the comparison between Seager and Rendon gets fascinating. When Seager's contract expired after the 2021 season, it was widely expected that Seattle would not re-sign him, given his age (turning 34) and the Mariner's youth movement (JP Crawford, Julio Rodriguez, and Cal Raleigh). What was not expected was that Seager would choose to retire, stating that he wanted to spend more time with his family. He took the $2M buyout on the option year of his contract and retired to Salisbury, North Carolina, near where he grew up.
So we have two similar players who achieved the same goal: financial security for their family and time to enjoy it away from the grind of the Major League Baseball schedule. With quite a difference in how they got there.